jap it works now Great
thanks
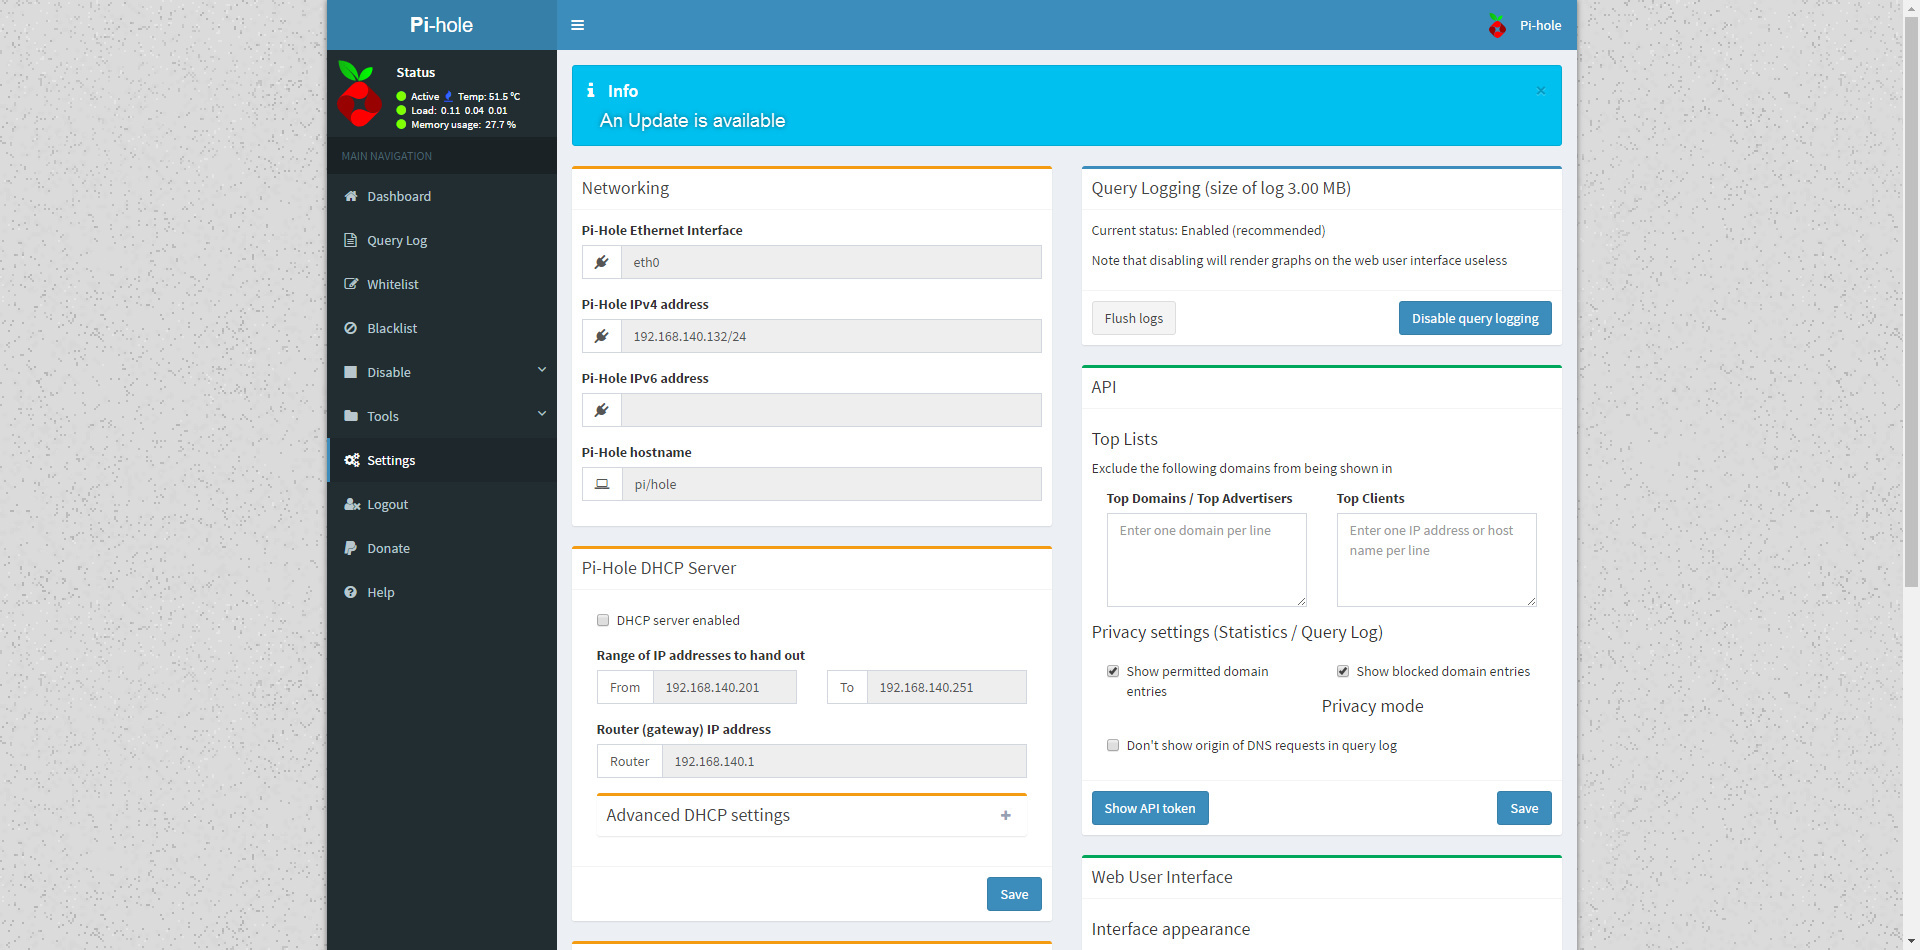
btw what would be great if you could make a banner on the web interface that tells us if there is an new version available
then i can just hop over and update 

jap it works now Great
thanks
btw what would be great if you could make a banner on the web interface that tells us if there is an new version available
then i can just hop over and update
There should be a message at the bottom of the screen next to the version numbers if there's an update available.
ah okay
just that i dont allways see that
i thought something like this:

Installed dev version and it is GREAT! 
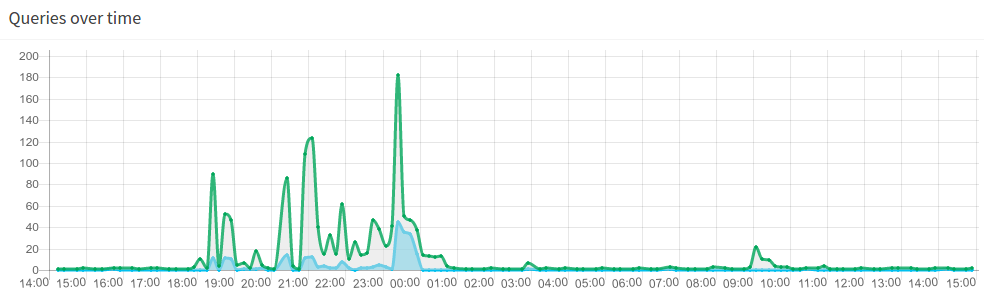
Does any one noticed that the time stamp in the graph is not correct?
I am post this reply now. The time is 14.20PDT. But the graph time already reach 15:00PM
I log in SSH and the time on the server is correct.
# date
Wed Mar 15 14:22:04 PDT 2017
Log file:
# tail pihole.log
Mar 15 13:55:58 dnsmasq[538]: reply plex.tv is 54.229.174.245
Mar 15 14:10:58 dnsmasq[538]: query[A] plex.tv from 10.11.22.112
Mar 15 14:10:58 dnsmasq[538]: forwarded plex.tv to 208.67.220.220
Mar 15 14:10:58 dnsmasq[538]: forwarded plex.tv to 208.67.222.222
Mar 15 14:10:58 dnsmasq[538]: reply plex.tv is 52.214.149.31
Mar 15 14:10:58 dnsmasq[538]: reply plex.tv is 54.229.174.245
Mar 15 14:10:58 dnsmasq[538]: reply plex.tv is 52.210.15.168
Mar 15 14:10:58 dnsmasq[538]: reply plex.tv is 52.17.240.145
Mar 15 14:10:58 dnsmasq[538]: reply plex.tv is 54.77.213.127
Mar 15 14:10:58 dnsmasq[538]: reply plex.tv is 52.210.223.97
I am in the develop branch now.
I notice it because it has a small bump around 9Am-10AM when nobody at home.
You checked that the time of the server is correct. How about the computer you use for viewing the graphs?
Background: The timestamps are transported as UNIX timestamps to your browser and actually all conversion into local time is happening here.
The client computer I am using has the correct local time (PDT).
The pi-hole server is a ESXi VM. The ESXi host is using UTC time. The VM is using local time Pacific Daylight Time(PDT).
I just did a "dig" on pi-hole from another VM at 16:01PM. What I observed:
We have the FTL environment running in various places in Europa and the US, so there is a bunch of different time zones involved and we haven't seen this before. By any chance, have you changed the time zone only recently and never restarted the computer afterwards? I know that this is a bit grasping at straws, but I'm a bit out of ideas what might be happening here.
Another thing you could look at:
http://pi.hole/admin/api.php?overTimeData10mins
The output will look like:
{"domains_over_time":{"1489532700":21,[...],"1489621500":0}}
Does the very last time stamp (would be 1489621500 in my example) represent your current time correctly?
You can check e.g. using `date:
mq@laptop:~ $ date -d @1489621500
Thu Mar 16 00:45:00 CET 2017
which translates into my correct local time.
I didn't change timezone.
I am in Pacific timezone and on March 12 we just started daylight saving time.
Here is the test I just did on the server:
root@pi-hole:~# curl http://10.11.22.62/admin/api.php?overTimeData10mins
{"domains_over_time":{"1489536900":1,"1489537500":1,"1489538700":1,"1489539300":3,"1489539900":10,"1489540500":2,"1489541100":90,"1489541700":4,"1489542300":52,"1489542900":47,"1489543500":5,"1489544100":6,"1489544700":2,"1489545300":18,"1489545900":5,"1489546500":2,"1489547100":1,"1489548300":86,"1489548900":4,"1489549500":1,"1489550100":108,"1489550700":123,"1489551300":40,"1489551900":15,"1489552500":33,"1489553100":15,"1489553700":62,"1489554300":10,"1489554900":26,"1489555500":14,"1489556100":16,"1489556700":47,"1489557300":38,"1489557900":22,"1489558500":41,"1489559100":182,"1489559700":50,"1489560300":47,"1489560900":37,"1489561500":14,"1489562100":13,"1489562700":12,"1489563300":13,"1489563900":4,"1489564500":2,"1489565700":1,"1489566300":1,"1489567500":1,"1489568100":2,"1489569300":1,"1489569900":1,"1489571100":1,"1489571700":6,"1489572900":1,"1489573500":2,"1489574700":1,"1489575300":2,"1489576500":1,"1489577100":1,"1489578300":1,"1489578900":2,"1489580100":1,"1489580700":1,"1489581900":1,"1489582500":2,"1489583700":1,"1489584300":1,"1489585500":3,"1489586100":2,"1489587300":1,"1489587900":1,"1489589100":1,"1489589700":3,"1489590900":2,"1489591500":1,"1489592700":1,"1489593300":3,"1489593900":21,"1489594500":10,"1489595100":9,"1489595700":4,"1489596300":3,"1489596900":3,"1489597500":1,"1489598100":1,"1489598700":2,"1489599900":2,"1489600500":4,"1489601100":1,"1489601700":1,"1489602300":1,"1489603500":1,"1489604100":2,"1489605300":1,"1489605900":1,"1489607100":2,"1489607700":2,"1489608900":2,"1489609500":1,"1489610700":1,"1489611300":2,"1489612500":2,"1489613100":1,"1489614300":1,"1489614900":2,"1489616100":1,"1489616700":1,"1489617900":1,"1489618500":2,"1489619700":2,"1489620300":1,"1489621500":1,"1489622100":3,"1489622700":1,"1489623300":1,"1489623900":1,"1489625100":2,"1489625700":4},"ads_over_time":{"1489536900":0,"1489537500":0,"1489538700":0,"1489539300":0,"1489539900":0,"1489540500":0,"1489541100":11,"1489541700":0,"1489542300":11,"1489542900":10,"1489543500":0,"1489544100":1,"1489544700":1,"1489545300":1,"1489545900":2,"1489546500":0,"1489547100":0,"1489548300":14,"1489548900":0,"1489549500":0,"1489550100":11,"1489550700":12,"1489551300":3,"1489551900":4,"1489552500":2,"1489553100":2,"1489553700":7,"1489554300":2,"1489554900":0,"1489555500":2,"1489556100":2,"1489556700":3,"1489557300":5,"1489557900":3,"1489558500":1,"1489559100":45,"1489559700":35,"1489560300":34,"1489560900":15,"1489561500":0,"1489562100":0,"1489562700":0,"1489563300":0,"1489563900":0,"1489564500":0,"1489565700":0,"1489566300":0,"1489567500":0,"1489568100":0,"1489569300":0,"1489569900":0,"1489571100":0,"1489571700":1,"1489572900":0,"1489573500":0,"1489574700":0,"1489575300":0,"1489576500":0,"1489577100":0,"1489578300":0,"1489578900":0,"1489580100":0,"1489580700":0,"1489581900":0,"1489582500":0,"1489583700":0,"1489584300":0,"1489585500":1,"1489586100":0,"1489587300":0,"1489587900":0,"1489589100":0,"1489589700":0,"1489590900":0,"1489591500":0,"1489592700":0,"1489593300":0,"1489593900":0,"1489594500":0,"1489595100":0,"1489595700":0,"1489596300":0,"1489596900":0,"1489597500":0,"1489598100":0,"1489598700":1,"1489599900":0,"1489600500":0,"1489601100":0,"1489601700":0,"1489602300":0,"1489603500":0,"1489604100":0,"1489605300":0,"1489605900":0,"1489607100":0,"1489607700":0,"1489608900":0,"1489609500":0,"1489610700":0,"1489611300":0,"1489612500":1,"1489613100":0,"1489614300":0,"1489614900":0,"1489616100":0,"1489616700":0,"1489617900":0,"1489618500":0,"1489619700":0,"1489620300":0,"1489621500":0,"1489622100":0,"1489622700":0,"1489623300":0,"1489623900":0,"1489625100":0,"1489625700":1}}root@pi-hole:~#
root@pi-hole:~#
root@pi-hole:~# date
Wed Mar 15 17:03:36 PDT 2017
root@pi-hole:~#
root@pi-hole:~# date -d @1489625700
Wed Mar 15 17:55:00 PDT 2017
root@pi-hole:~#
Addendum:
There's nothing in the standard library to do re-read the time zone. It seems like it will stick with whatever the time zone was when the process (in this case pihole-FTL) was started. I'm researching on ways to re-process the timezone at least once a day, but that seems quite tricky.
Please try a sudo service pihole-FTL restart
Restarted the service and still the same.
We can try to sort that out together, but it is already way beyond midnight for me, so I'd like to shift that for later 
Last night at home, I tried restarted the pi-hole VM, also tried different browser and the problem still exist.
This morning I found something changed: The graph back to show today only. And "Forward Destinations over Time" couldn't load. So I think something must changed in the night. I poke around and found the cronjob "pihole updateGravity".
So I did "pihole checkout dev" again. Now it bring back the dev branch just like yesterday, with the timestamp issue. (Pi-hole Version vDev (development, v2.12.1-278-g073c7e5) Web Interface Version vDev (devel, v2.4-199-gd350bcb)
So do I have to do this everyday to keep on the dev branch? Or should I need to disable the cronjob?
@DL6ER Thank you for the following up.
I rolled back to the stable version because of the time stamp issue last week.
I just pull the dev version again and this current version works fine. (Pi-hole Version vDev (development, v2.12.1-313-g5a4f088) Web Interface Version vDev (devel, v2.4-246-g5092133) FTL Version v1.10.3)
I am looking forward to see this feature merge into the stable version soon.
Thank you for the great product!
FTL does a rolling 24 hour graph. I believe this satisfies your feature request. Is that correct @dynaguy?
Great! Right on time. I use pi-hole to block youtube ad but last night it suddenly stop working. I just remote upgraded it to this 274 FTL and I'll see how it works tonight.
The 24 hr graph looks nice now.
Closing topic to release votes users have spent on this one.