This question may sound a bit crazy but I have a reason asking this
What exactly counts for the green field "Total Queries" in the dashboard? I'm wondering if PTR queries are excluded as I have a separate ELK stack which collects and displays the pihole log like the internal dashboard does. However, if I include PTR I get a LOT more total queries in my elk stack during the same period of time, so:
What is piholes filter for counting the queries?
PS: For sure there is the possibility that my logstash configuration is faulty or incorrectly filtered ...
Thanks for your help - you're all doing a great job!
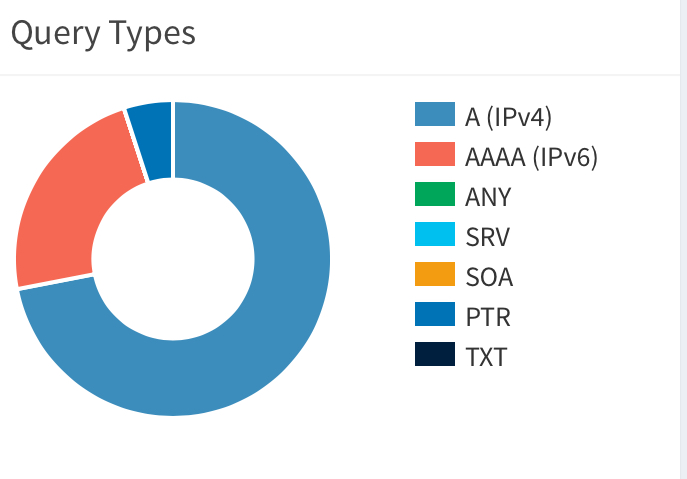
The displayed number is the number of queries in the Query Log. The query log contains only A and AAAA records. I coded a potential improvement. @n9nes please check if you'd find this sufficient:
yes thats sufficient in my case as I actually dont really need this query counter. It was just out of couriosity as I was wondering why my ELK stack is displaying so many more (all query types) queries.
But in my personal oppinion it would be more transparent to display all query types instead of only A and AAAA for the people actually using the pihole dashboard
This was my first thought. I could an all query types as an advanced option to enable, but I think the current behavior is what is expected and makes the most sense.
I'm not sure, the numbers would be artificially inflated. Things like an A query that returns a CNAME, which is then resolved down to the A records of the new FQDN would be listed as multiple hits, when it's really just a single query from my point of view. And PTRs for ARPA addresses just don't really have any bearing on the function of the Pi-hole with blocking.
DanSchaper
Things like an A query that returns a CNAME, which is then resolved down to the A records of the new FQDN would be listed as multiple hits, when it’s really just a single query from my point of view
correct my if I'm wrong but that depends on the type of filter you apply to the log lines. The actual A record query IS NOT exactly the same as the CNAME answers so we can distinguish between them. The request count would be the same and the answer count would raise
Dont get me wrong, I dont really need this as a feature, was just wondering why there is such a high difference between pihole und my ELK stack.