looking forward for its release
Yeah it's been crazy. Plus with the holiday I've been zapped of all spare time.
I need to get a third pi for the dev branch so I stop breaking my current one.
I set one up in a VM, but it has been annoying to work with.
I'll for sure be jumping in more actively starting in Jan. when I change positions at work.
Just checked out everything in the 2.0 release of the admin page, so I'm excited to get back to it.
Happy holidays everyone. Hopefully I can get this into the default install so you won't need to mess with any css/js files/
2 Likes
and when we can install this dark theme :D?
I'm waiting for it. Maybe in the next update..eh?
Still plucking away at it.
I don't have tons of free time these days to work on side-projects, but I still have it on my todo list.
If I can find some time this weekend I'll just upload the css/js file for anyone who wants the current look.
4 Likes
I am definitely interested in this theme! Good job so far!
can u tell us, where the css/js file is. so maybe i can create my own look 
AdminLTE/scripts/pi-hole at master · pi-hole/AdminLTE · GitHub - JS/PHP files
AdminLTE/style/vendor at master · pi-hole/AdminLTE · GitHub - CSS
I just added a new sheet and included it in the header.php file.
As for the actual location on the Pi, I don't have mine handy and I can't quite remember the directory.
Should just be in the /var/www/ folder.
You can also just use the Stylish extension and write a CSS sheet in there. You just won't be able to change the graphs.
Here is mine from Stylish, ignore the messy redundant CSS classes, haven't cleaned up this one yet and I mainly used it to test new changes.
pi_dark_12-24-2016.csv (10.4 KB)
Uploaded as a CSV so it would actually attach, but just open it in any text editor and copy everything into a Stylish sheet. Just note the graphs will be default since the colors are applied in the JS file.
EDIT: Also it has only been tested in Chrome so I take no responsibility for it not working in other browsers.
My current one has been rewritten to work with all browsers, though I'm not sure when I will have time to finish it.
3 Likes
It will be nice if it is implemented in the next update...
/var/www/html/admin ![]()
Oh no! Features get shy when you put pressure onto them to come out! It then takes us longer to coax them out from their hidey-holes... ETA: Soon™ ![]()
1 Like
100% development approved.
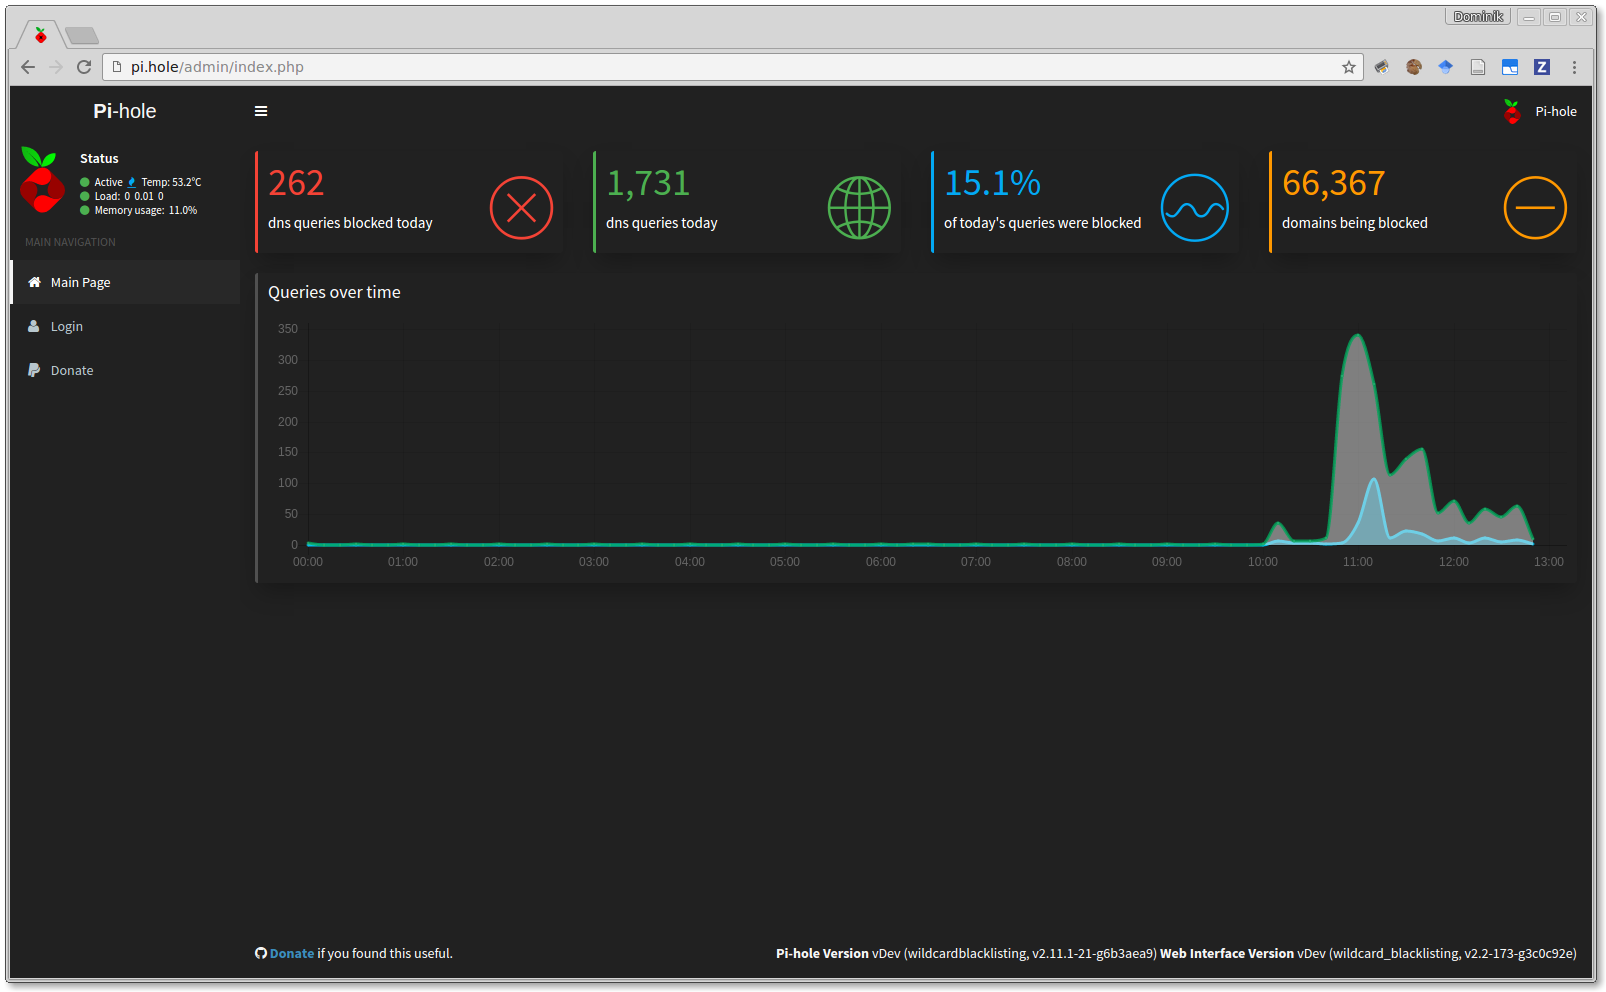
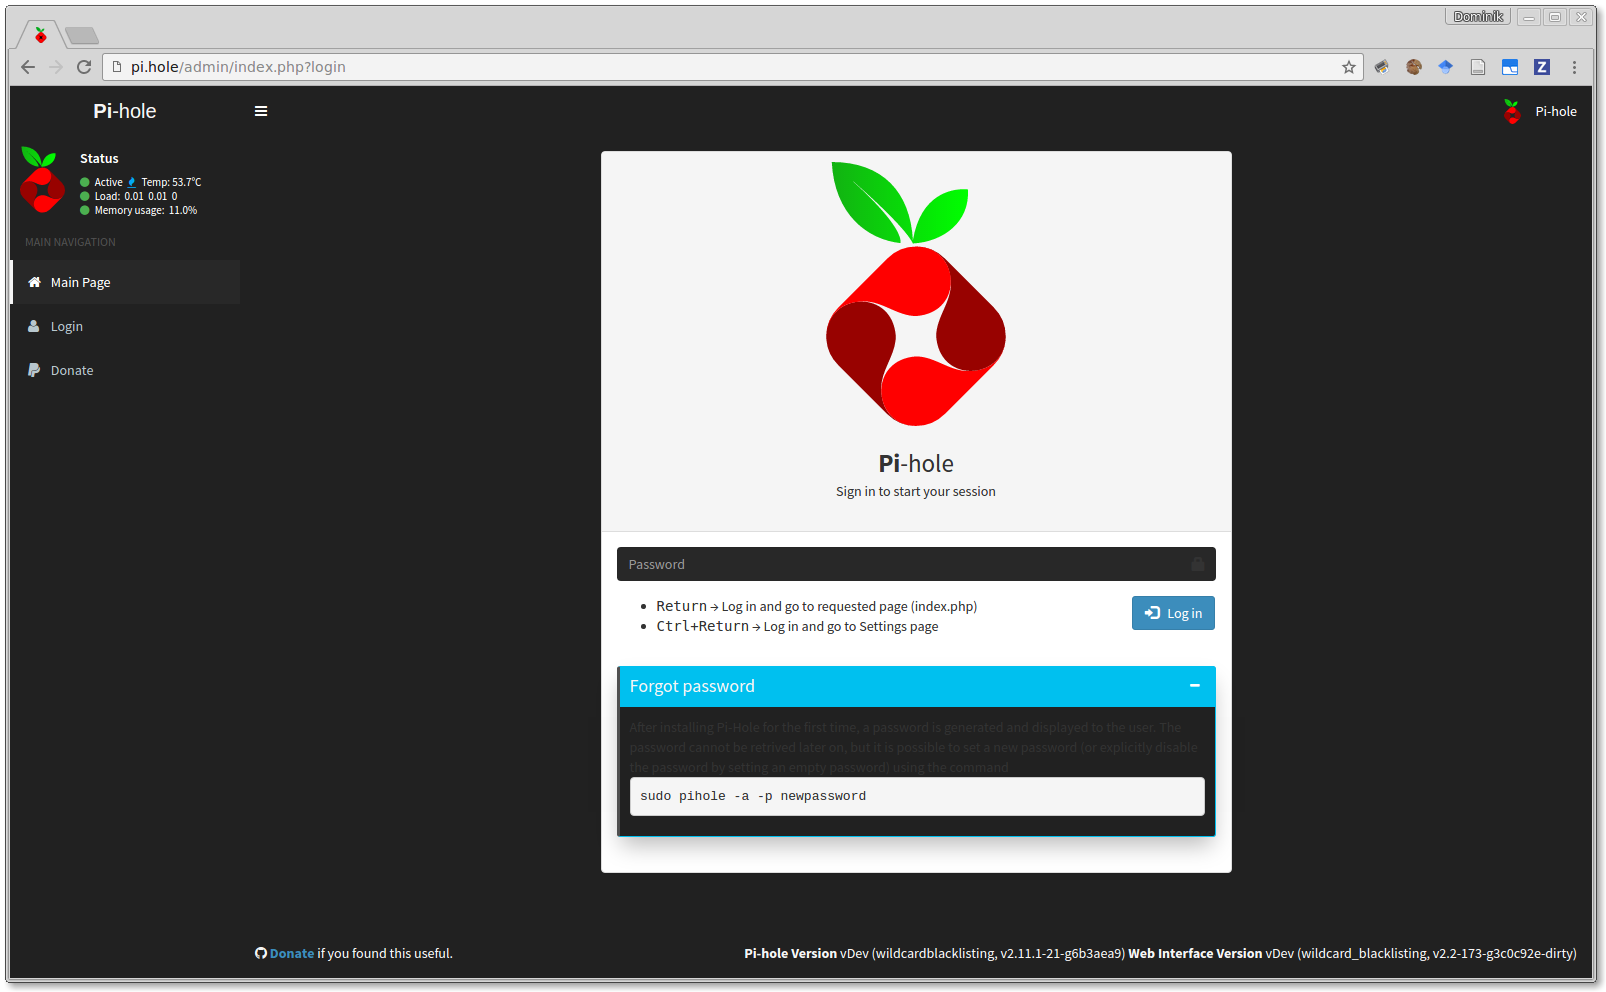
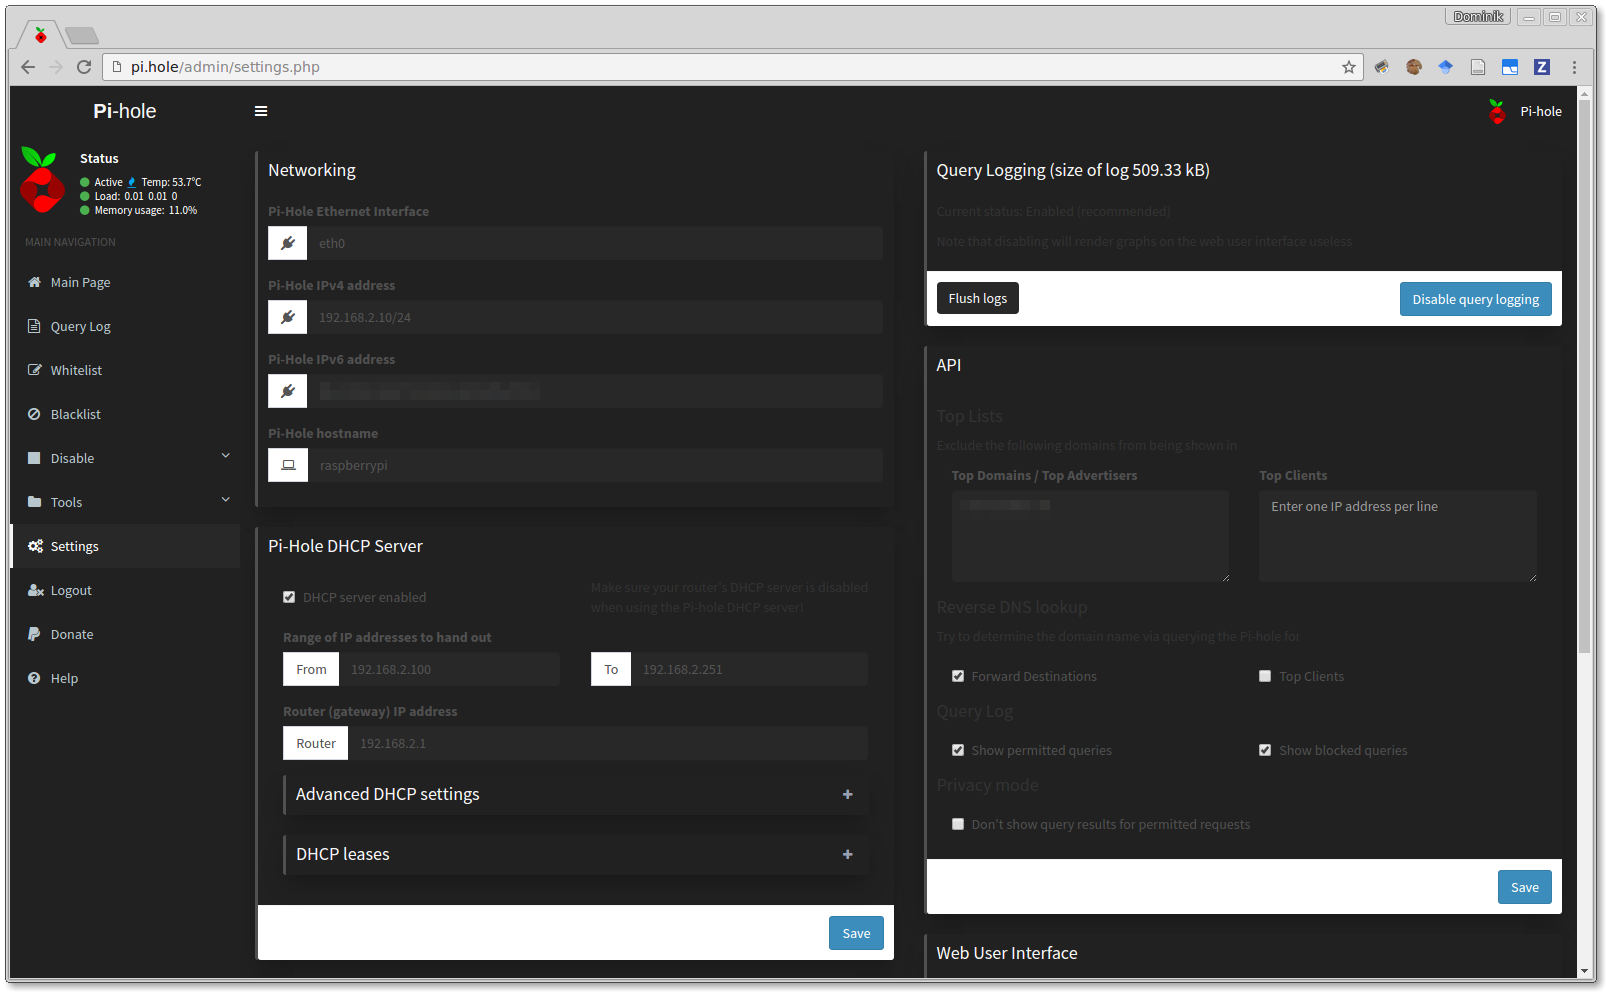
I just tried it and it is not completely ready so we cannot use it as drop-in-replacement.
Some examples:
Main page
Log in page
Settings page
1 Like
The main page graphs are unable to be styled via CSS.
For the main page graphs I pasted most of the index.js below, not sure if it will line up with the current version though. I haven't updated it in awhile.
I'll have to look into the login page, it wasn't around when I initially wrote it, nor were the settings.
Here's the snippet from the JS file I have on my laptop, not sure if it's in a working state or not.
The way the graphs are generated is not my favorite which is what started my rewrite of the whole dashboard.
Also I believe I had to override the AdminLTE colors in another file for it to actually take effect.
var AdminLTEOptions = {
        colors: {
            lightBlue: "#03A9F4",
            red: "#f44336",
            green: "#4CAF50",
            aqua: "#00BCD4",
            yellow: "#FFEB3B",
            blue: "#2196F3",
            navy: "#3F51B5",
            teal: "#009688",
            olive: "#8BC34A",
            lime: "#CDDC39",
            orange: "#FF9800",
            fuchsia: "#673AB7",
            purple: "#9C27B0",
            maroon: "#880E4F",
            black: "#212121",
            gray: "#d2d6de"
        }
    }
    updateSummaryData();

    updateQueriesOverTime();

    updateQueryTypes();

    updateTopClientsChart();

    updateForwardDestinations();

    updateTopLists();
    var ctx = document.getElementById("queryOverTimeChart").getContext("2d");
    var gradient = ctx.createLinearGradient(0, 0, 0, 400);
    gradient.addColorStop(0, 'rgba(76,175,80,0.5)');
    gradient.addColorStop(0.45, 'rgba(76,175,80,0.2)');
    gradient.addColorStop(1, 'rgba(76,175,80,0)');


    // Create charts
    var chartData = {
        labels: [],
        datasets: [
            {
                label: "All Queries",
                fillColor: gradient,
                strokeColor: "rgba(76, 175, 80,.8)",
                pointColor: "rgba(76, 175, 80,.8)"
            },
            {
                label: "Ad Queries",
                fillColor: "rgba(0,192,239,0.5)",
                strokeColor: "rgba(0,192,239,1)",
                pointColor: "rgba(0,192,239,1)"
            }
        ]
    };
    var isMobile = {
        Windows: function() {
            return /IEMobile/i.test(navigator.userAgent);
        },
        Android: function() {
            return /Android/i.test(navigator.userAgent);
        },
        BlackBerry: function() {
            return /BlackBerry/i.test(navigator.userAgent);
        },
        iOS: function() {
            return /iPhone|iPad|iPod/i.test(navigator.userAgent);
        },
        any: function() {
            return (isMobile.Android() || isMobile.BlackBerry() || isMobile.iOS() || isMobile.Windows());
        }
    };
    var animate = false;
    timeLineChart = new Chart(ctx).Line(chartData,
        {   responsive: true,
            pointDot : true,
	        pointDotRadius: 2.5,
            legendTemplate : "<ul class=\"<%=name.toLowerCase()%>-legend\"><% for (var i=0; i<datasets.length; i++){%><li><span style=\"background-color:<%=datasets[i].strokeColor%>\"></span><%if(datasets[i].label){%><%=datasets[i].label%><%}%></li><%}%></ul>",
        }
    );

    ctx = document.getElementById("queryTypeChart").getContext("2d");
    queryTypeChart = new Chart(ctx).Pie([],
        {   responsive: true,
	        segmentShowStroke: false,
            legendTemplate : "<ul class=\"<%=name.toLowerCase()%>-legend\"><% for (var i=0; i<segments.length; i++){%><li><span style=\"background-color:<%=segments[i].strokeColor%>\"></span><%if(segments[i].label){%><%=segments[i].label%><%}%></li><%}%></ul>",
            animation : animate
        }
    );

    ctx = document.getElementById("forwardDestinationChart").getContext("2d");
    forwardDestinationChart = new Chart(ctx).Pie([],
        {   responsive: true,
	        segmentShowStroke: false,
            legendTemplate : "<ul class=\"<%=name.toLowerCase()%>-legend\"><% for (var i=0; i<segments.length; i++){%><li><span style=\"background-color:<%=segments[i].strokeColor%>\"></span><%if(segments[i].label){%><%=segments[i].label%><%}%></li><%}%></ul>",
            animation : animate
        }
    );
});
I ordered another Pi to have at work so I can make progress on my version of the dashboard during lunches.
I updated the Charts.js engine in November
Unfortunately, this update is not backwards-compatible since Chart.js v2.0 is not backwards-compatible so your changes cannot serve as drop-in replacement. I can assist you with the rewriting of your theme for the current version of your web interface if you like.
I have a version working with Charts.js v2.* at home. I figured my local files on my laptop were probably outdated.
It only took a few minutes to switch it over when I made the change.
Threw this together, no idea if it works but it should in essence, also only pasted the relevant snippet.
var animate = false;
var ctx = document.getElementById("queryOverTimeChart").getContext("2d");
var gradient = ctx.createLinearGradient(0, 0, 0, 400);
gradient.addColorStop(0, 'rgba(76,175,80,0.5)');
gradient.addColorStop(0.45, 'rgba(76,175,80,0.2)');
gradient.addColorStop(1, 'rgba(76,175,80,0)');
timeLineChart = new Chart(ctx, {
    type: 'line',
    data: {
        labels: [],
        datasets: [
            {
                label: "All Queries",
                fill: true,
                backgroundColor: gradient,
                borderColor: "rgba(76, 175, 80,.8)",
                pointBorderColor: "rgba(76, 175, 80,.8)",
                pointRadius: 1,
                pointHoverRadius: 5,
                data: [],
                pointHitRadius: 20,
                cubicInterpolationMode: 'monotone'
            },
            {
                label: "Ad Queries",
                fill: true,
                backgroundColor: "rgba(0,192,239,0.5)",
                borderColor: "rgba(0,192,239,1)",
                pointBorderColor: "rgba(0,192,239,1)",
                pointRadius: 1,
                pointHoverRadius: 5,
                data: [],
                pointHitRadius: 20,
                cubicInterpolationMode: 'monotone'
            }
        ]
},Do we have any further progress on this? I love PiHole and the web interface but the new skin would be AWESOME!
Absolutely love the look of this cannot wait for it to be a part of the master release
So, is this dead or what?
doctormidnight has already submitted essential code, waiting for implementation by developers...
What I wrote is still relevant:
2 Likes